

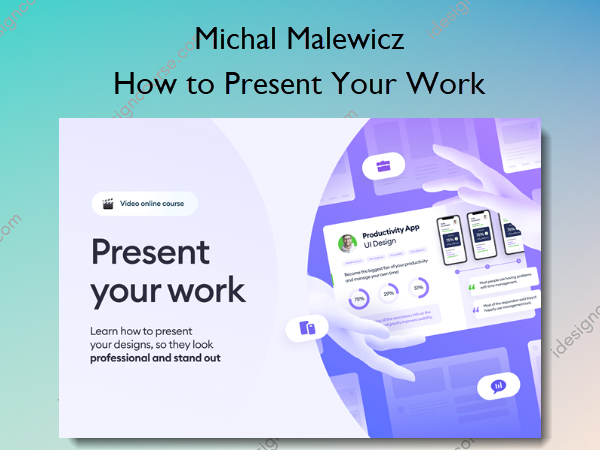
 How to Present Your Work Information
Running time: 2 hours 20 minutes
Why?
Presenting your work the right way, can lead to a dramatically different way others look at it, and as a result it benefits how they look at you as a designer.
What will you learn after the course?
The course will provide you with helpful & practical information on presenting you work
Making engaging presentations
First impressions are super important. I will show you how to make the best first impression and show your work in a way that will keep people interested and engaged.
Creating mockups and grids
The way you present your UI design can either enhance it or make it seem boring and uninteresting. I will show you how to create mockups the right way.
Presenting low-fidelity
Low fidelity wireframes are often neglected and shown in a low-fidelity way. We will explore techniques to keep them engaging and fun to look at while still being lo-fi.
Beautiful charts and graphs
Charts and graphs are a great way to show the results of your research in case studies. They can be beautiful to look at and stand out from generic, generated ones.
Data can be beautiful
Data tables and data sets can be shown in a way that makes it easier to connect all the right dots and have an awesome case study.
Here’s what you’ll learn
- create your own clay and minimal device mockups
- arrange the designs into grids (including special techniques like the 13° rule)
- Add overlays, objects, bitmaps to make your designs more alive
- pick the right order of your designs in the presentation, so that it has proper weight and is not boring
- apply proper shadows and background techniques
- use floating overlays
- And a lot more!
About Author
 Michal Malewicz is a highly skilled and experienced graphic designer and entrepreneur from Poland. He has a passion for design and has been involved in the design industry for many years. Michal is the founder of several successful companies, including Neoteric, a design agency that provides web development and design services to clients worldwide. He is also the creator of the Ultimate Design Toolkit, an online platform that offers a wide range of design resources and tools for designers, marketers, and entrepreneurs.
Michal is known for his expertise in design and entrepreneurship and has been featured in various publications, blogs, and events around the world. He has a strong commitment to helping other designers and entrepreneurs succeed, and he regularly shares his knowledge and insights through his blog and social media channels.
In addition to his work as a designer and entrepreneur, Michal is also a public speaker, mentor, and teacher. He has spoken at conferences and events on topics such as design thinking, entrepreneurship, and branding. Michal is a respected figure in the design community and is admired for his creativity, innovation, and leadership in the field of design and entrepreneurship.
More courses from the same author: Michal Malewicz
Salepage: How to Present Your Work – Square Planet academy – Michal Malewicz
Related products

»Pre-Order

»Pre-Order